Grafana sports a feature called Annotations that allow you to label a timestamp on a dashboard with meaningful events – most commonly deployments, campaigns, or outages:
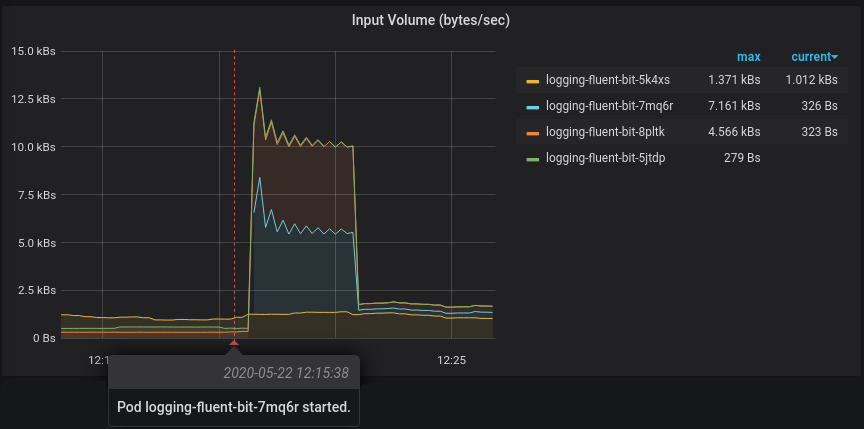
(In this case annotating the simulated deployment of a Fluent Bit container, which I’ve used to forward container logs out of the cluster.)
Annotations can be input manually, but the only recommendations I’ve seen to generate them automatically is to use something like Loki, or teaching your CI/CD system to interact with Grafana’s web API. However, if you’re running a simple Prometheus + Grafana stack (say, using the Prometheus Operator on Kubernetes), you might be reticent to add more complexity to your setup just to get deployment annotations.
Fortunately, there’s a simpler alternative for this narrow case: you can use the
process_start_time_seconds metric from Prometheus to get an approximate idea
of when apps or pods were started. I haven’t seen this approach recommended
elsewhere, which is the purpose of this post.
It turns out that process_start_time_seconds is exposed by almost all
applications because it’s one of the standard metrics recommended by Prometheus
itself
and is exported by most client libraries automatically (including my
own).
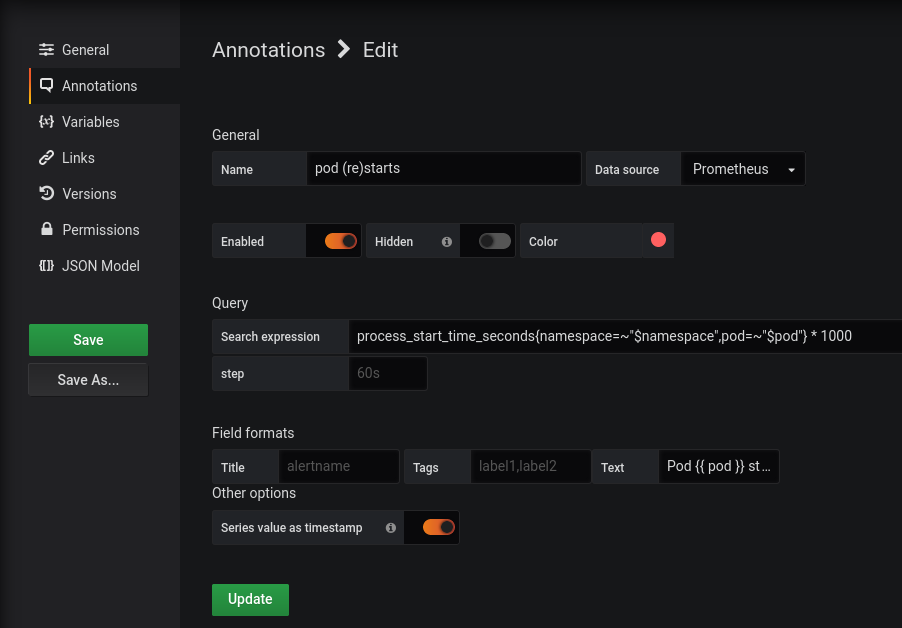
You can add annotations like the one in the image above as follows, assuming you
have a namespace and pod template
variable
defined:
It’s important to understand that these annotations will show only when new processes are started, most likely because of a deployment but also during rescheduling, scaling, or a pod failure – but since it is likely that you’d want to know about those as well, perhaps that’s a good thing.